
PROM Overview (sometimes referred to as the “Master Dashboard”) is for program level reporting of patient-reported outcomes. The metrics featured in this dashboard reflect implementation and outcome metrics.
Implementation
The overview initially displays the implementation metrics of the dashboards that you already access. For example, if you have access to Outpatient Services and Adult Day Hospital dashboards on DMAR Hub, you will only see those programs on the PROM Overview. Implementation metrics refer to the measurements that count how many patients have completed PROMs and how much PROM engagement exists within the program.
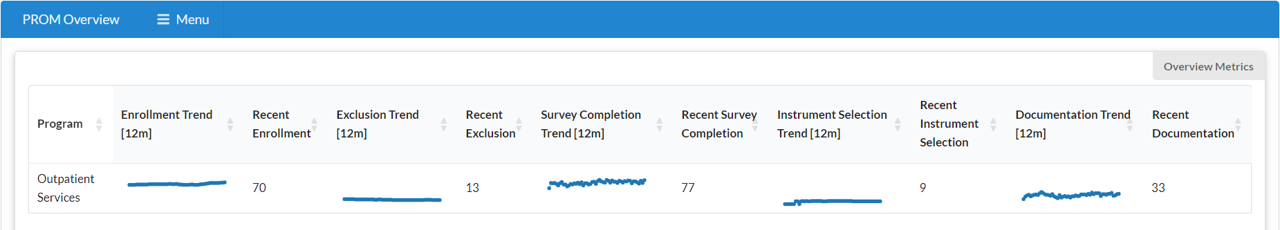
Implementation metrics include:
- Enrolled – how many patients have completed the first/admission PROM assessment,
- Excluded – how many patients have been marked as excluded from PROM,
- Completion – how many patients have completed their follow-up PROMs,
- Instrument Selection – how many patients have additional PROMs selected,
- Documentation – how many completed PROM assessments have been pulled into Sunrise notes.
On the top right, you will find the Menu. Selecting this will display Overview (the first screen you will see above) and Program Reporting.
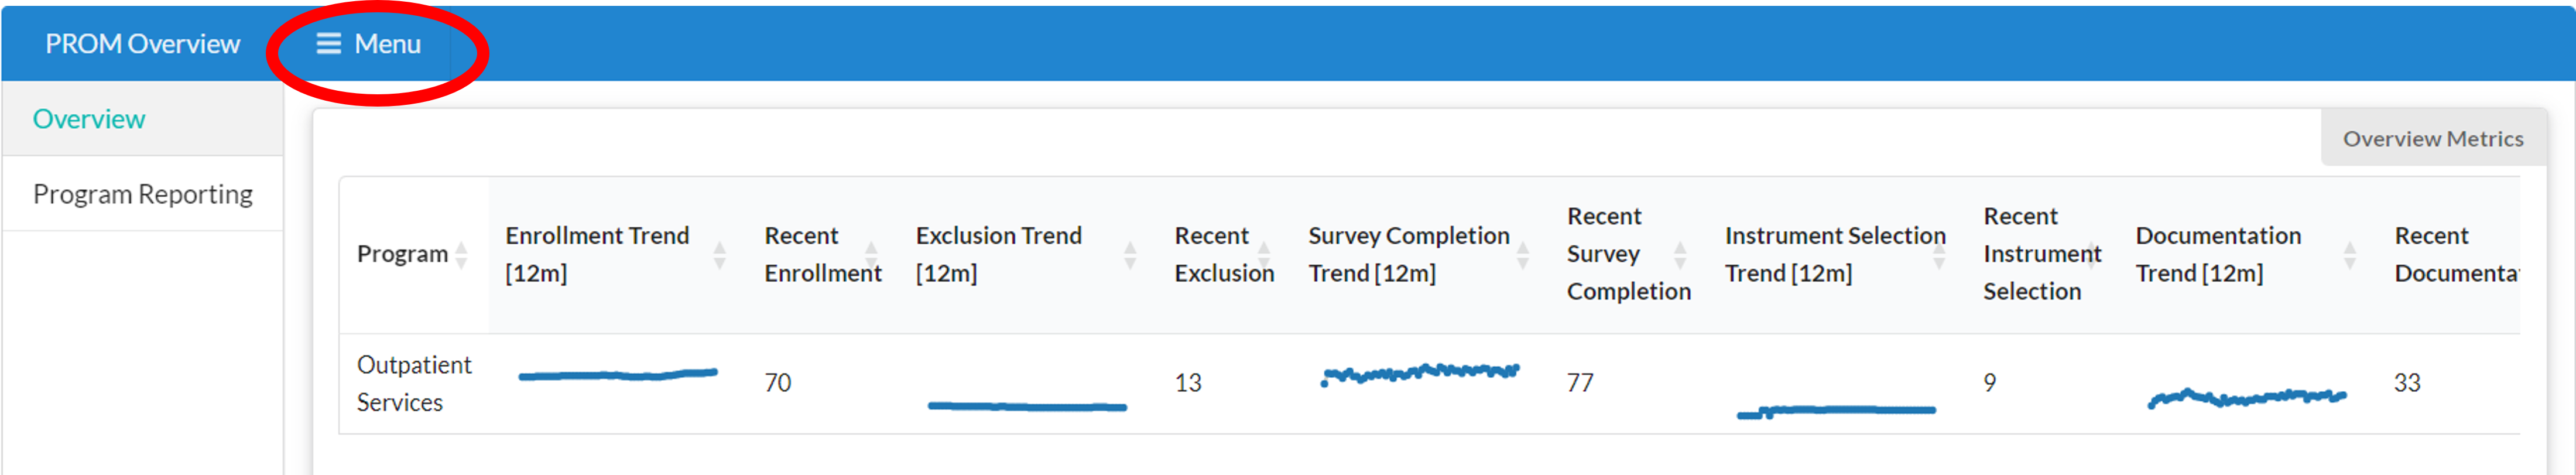
Select Program Reporting for more detailed metrics for each PROM dashboard/program. You can select Menu again to close of side panel and expand the table.
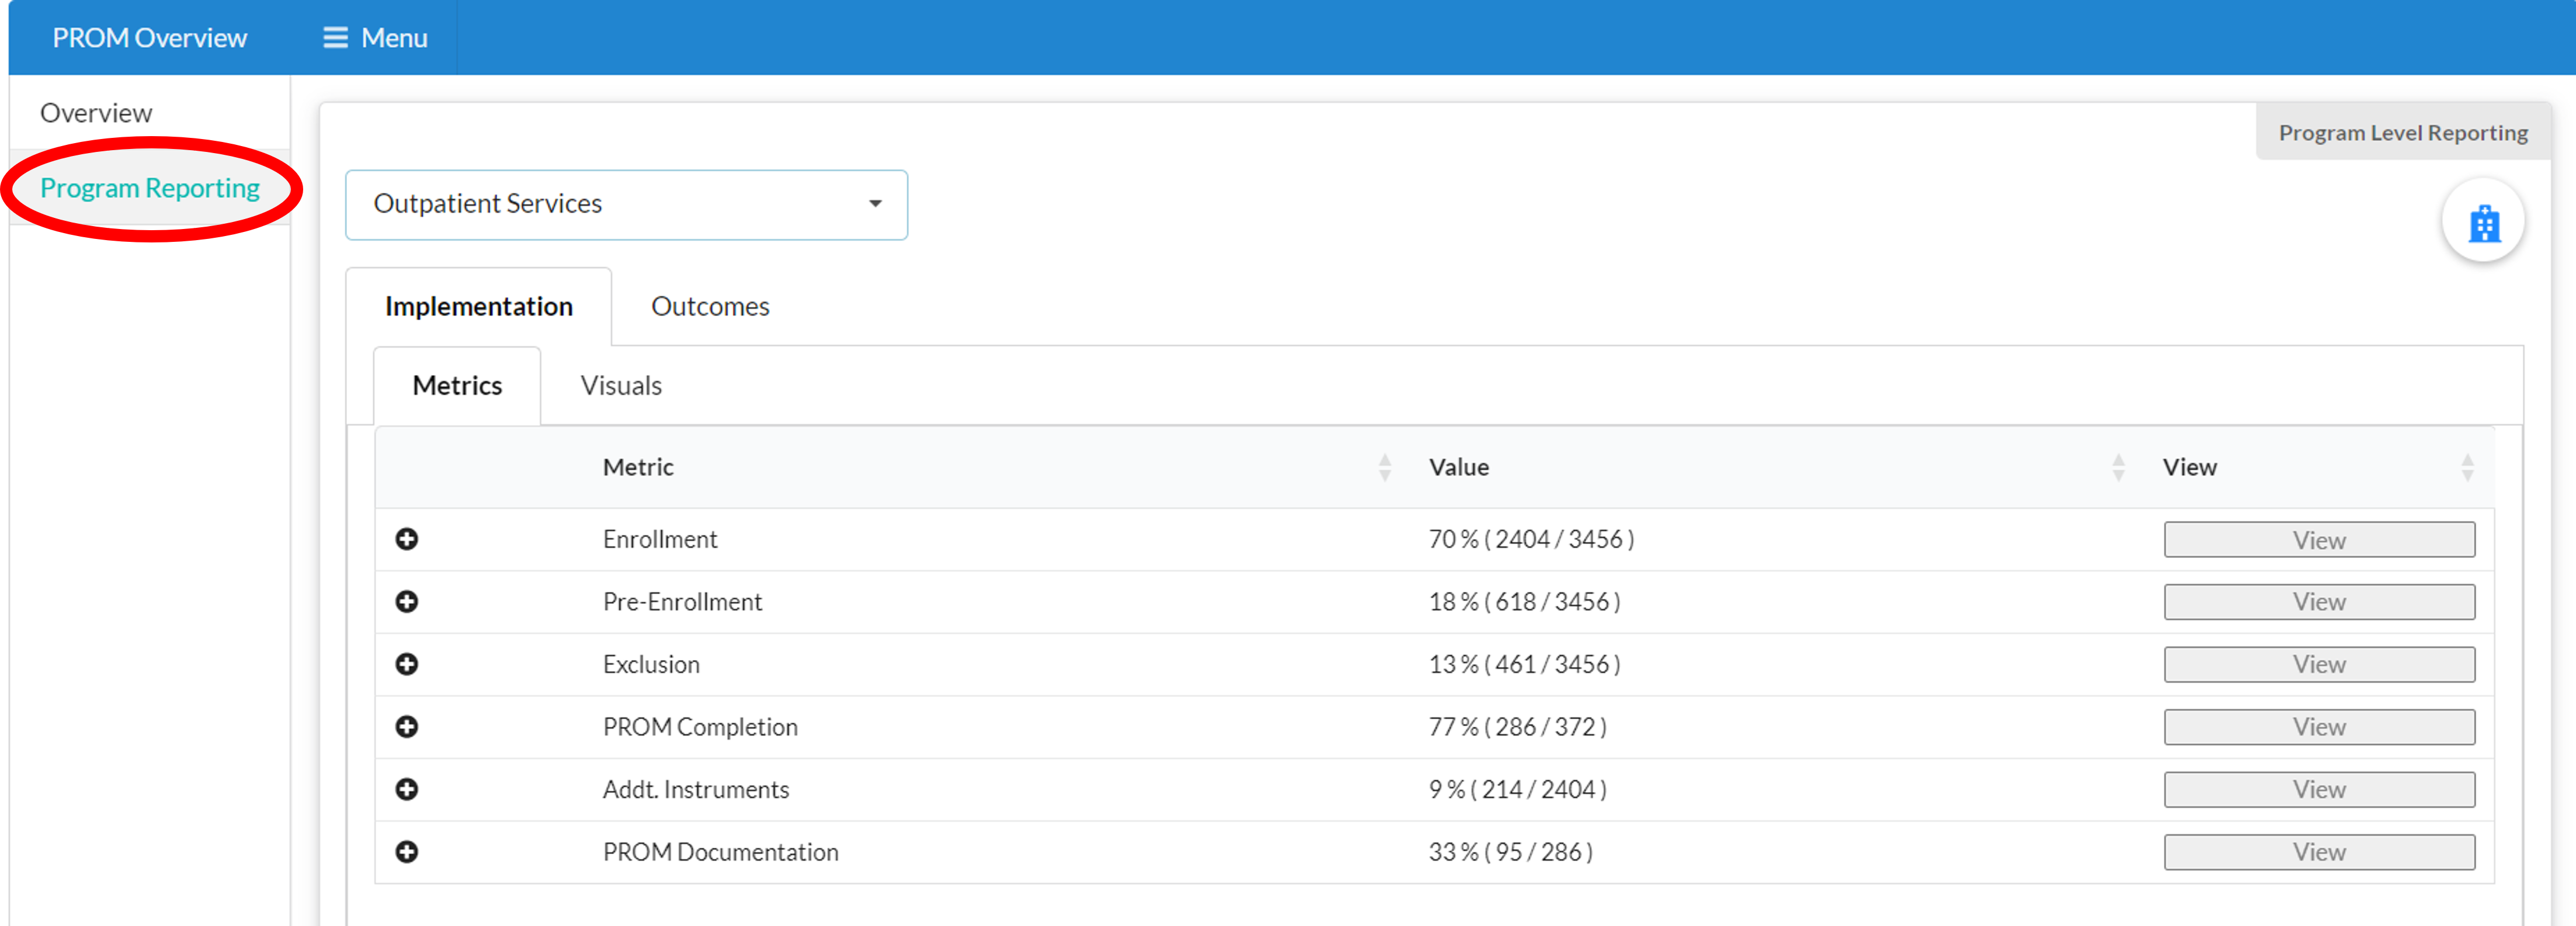
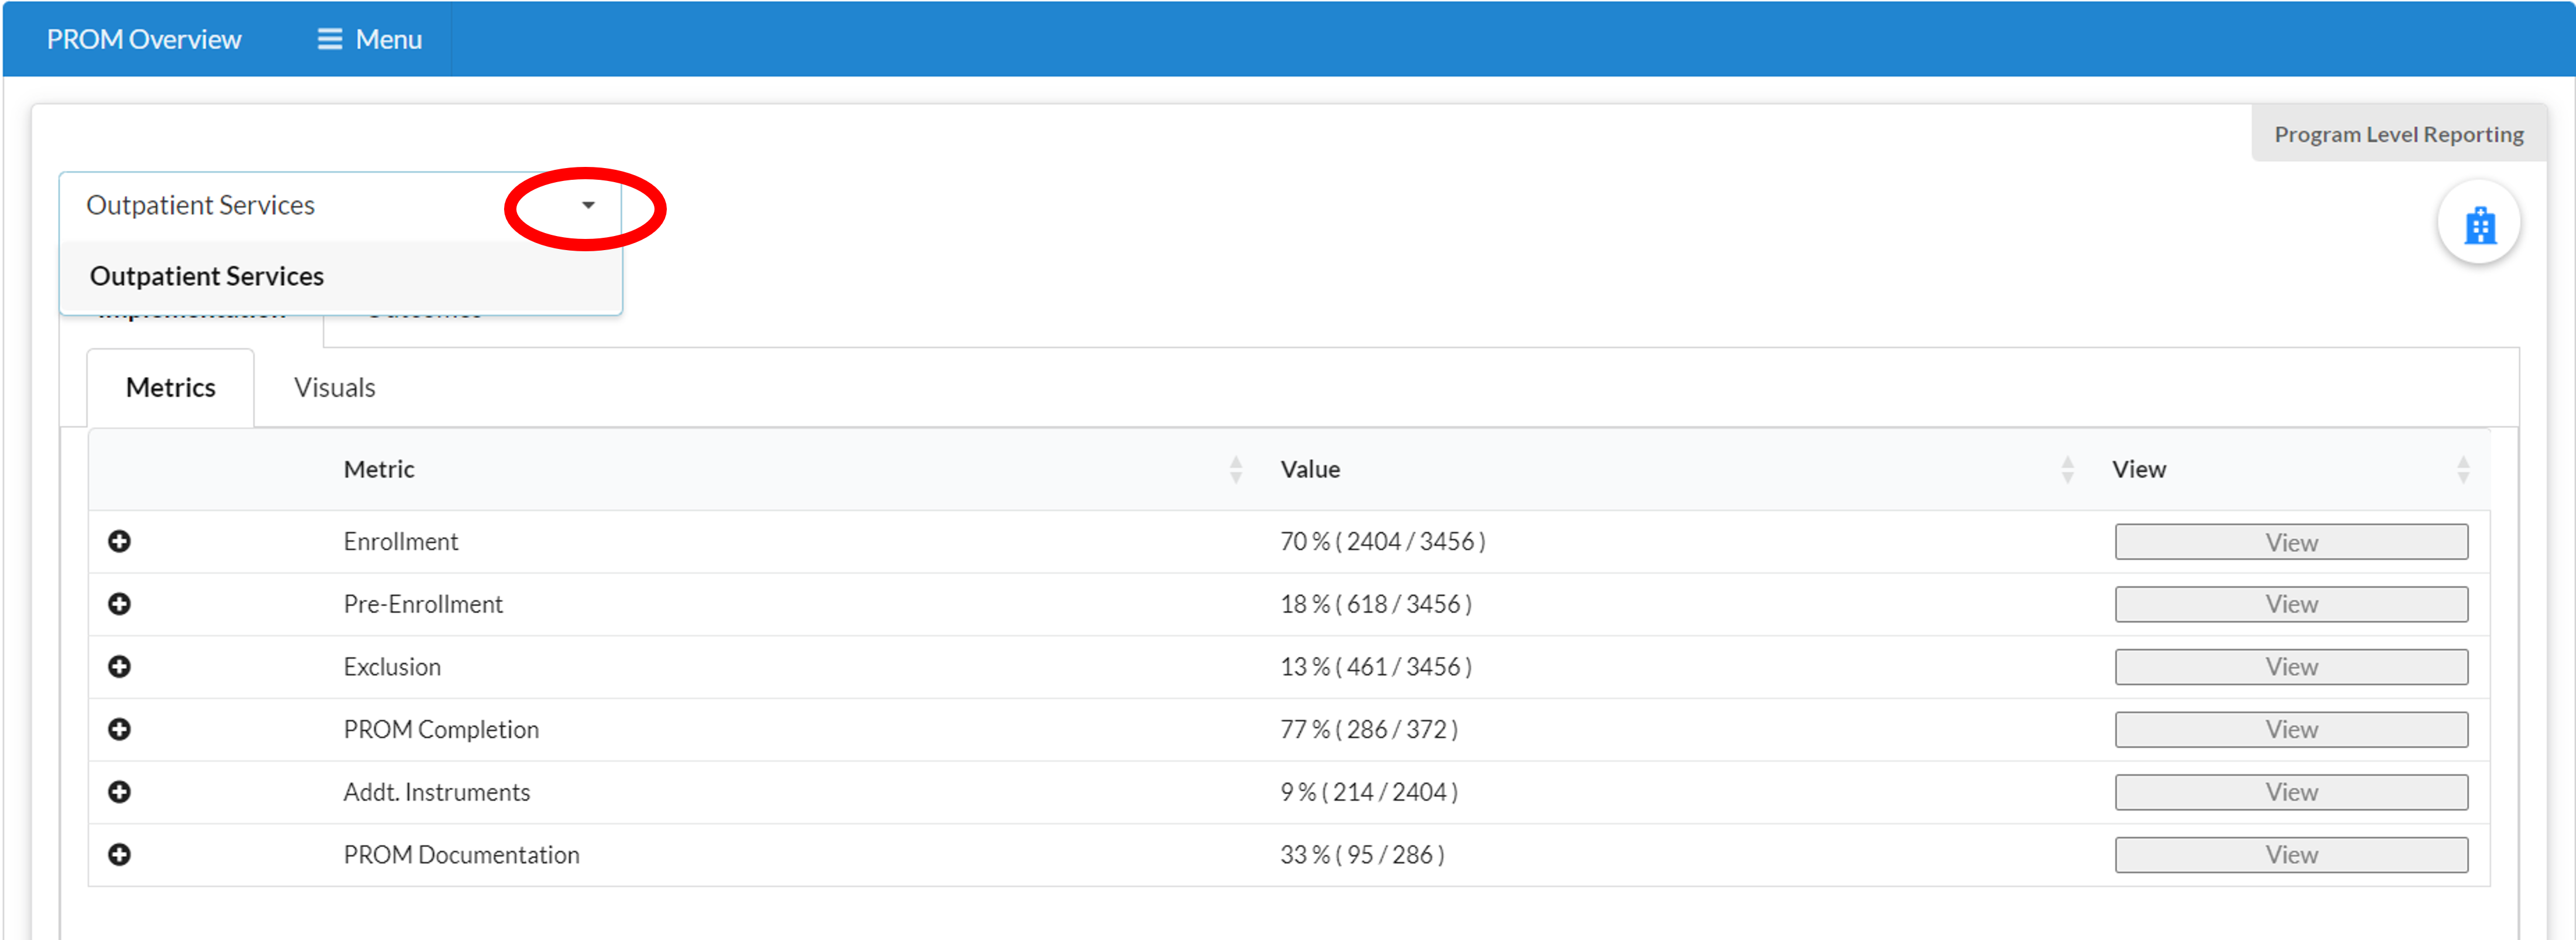
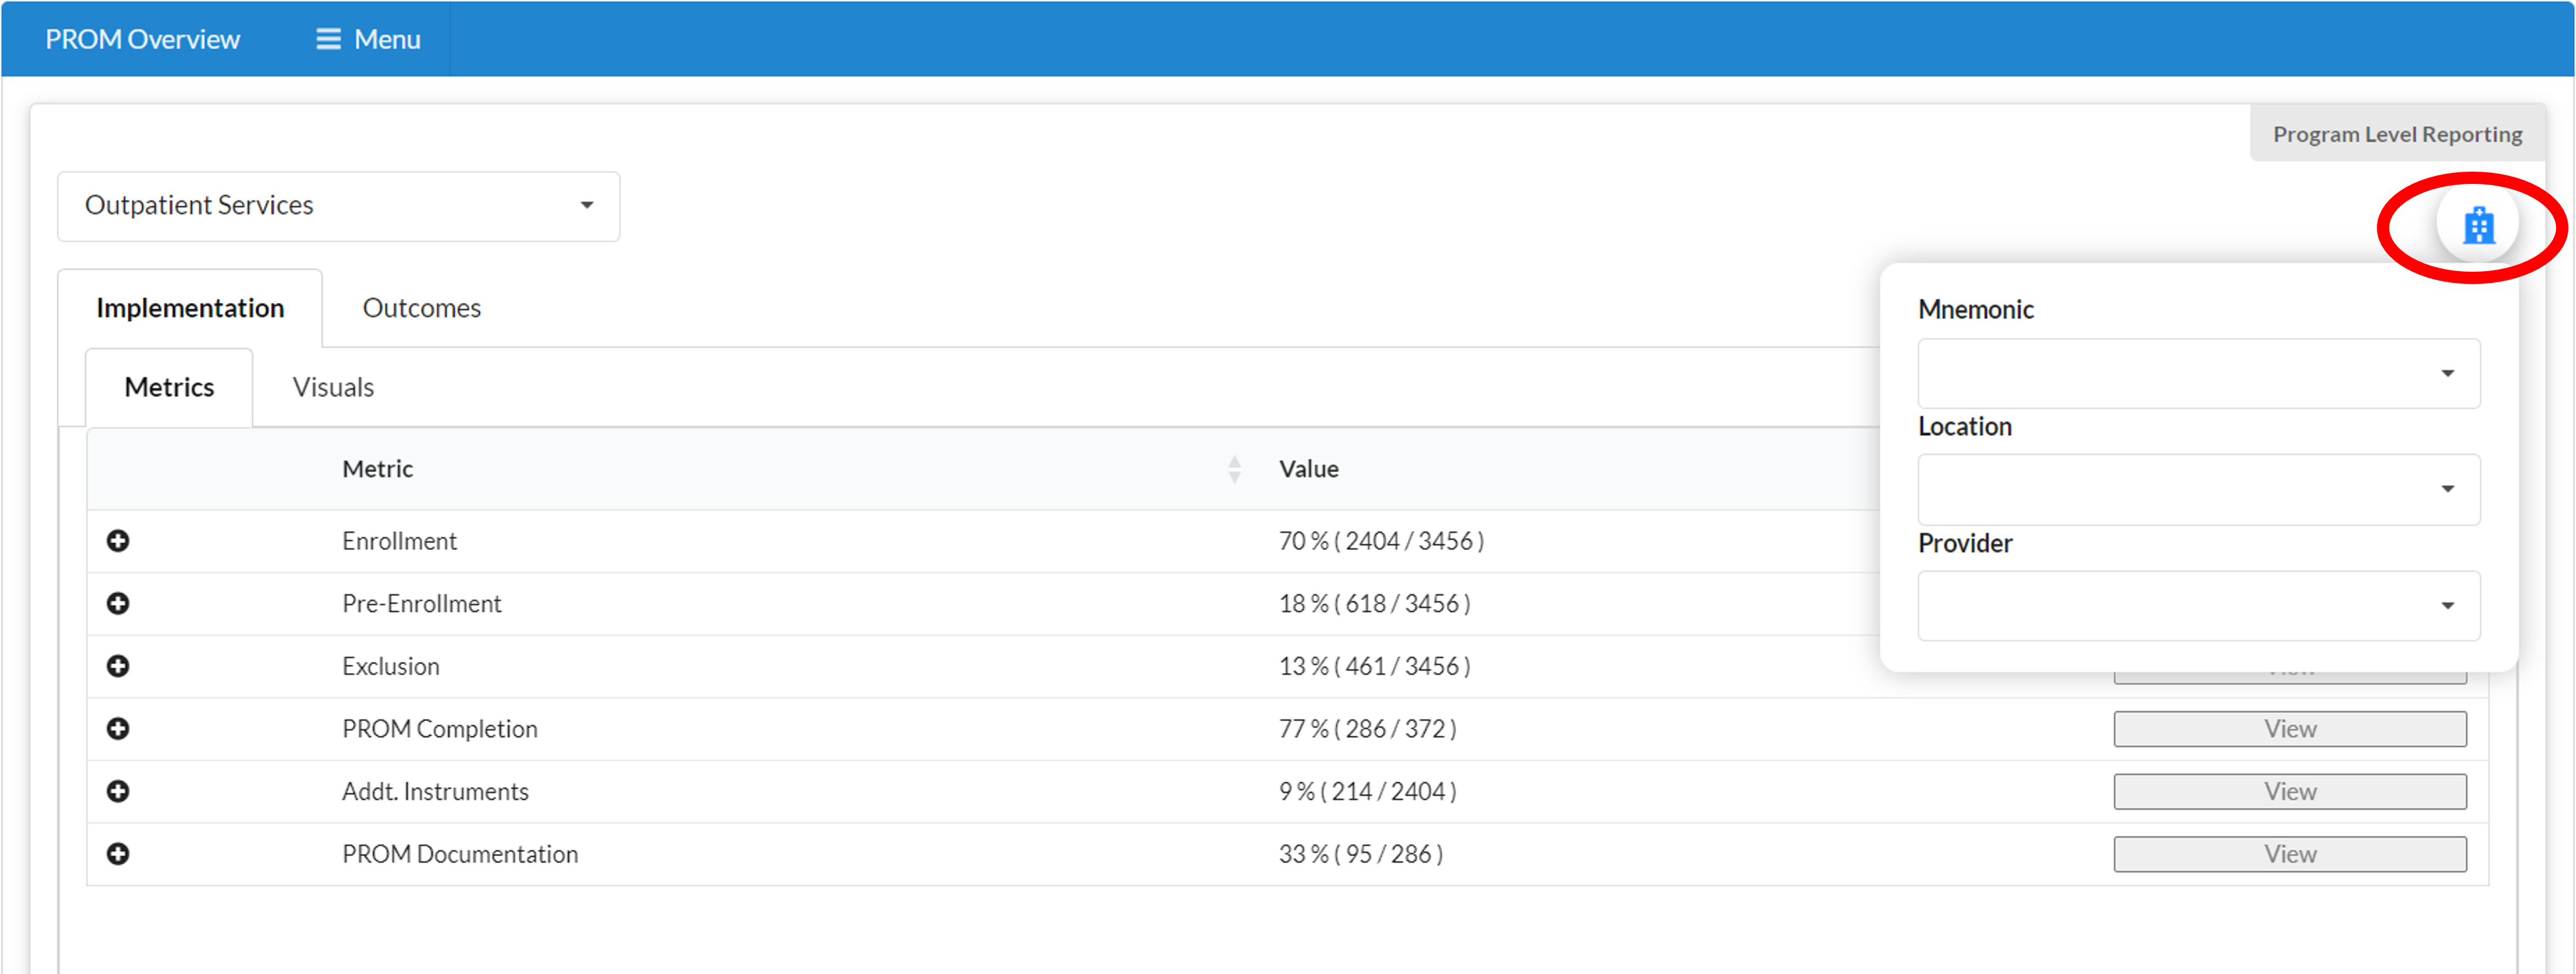
On the Program Reporting view, you will first see the detailed view of the Implementation metrics. Above the table, on the left, you can select another PROM dashboard/program using the drop down option (the ability to view other program metrics is only available if you have been granted access to multiple dashboards/programs).
Above the table, on the right, you can click on the hospital icon to filter by specific mnemonics, locations, and program providers that are associated with the selected dashboard/program. The metrics will automatically adjust based on your choices.
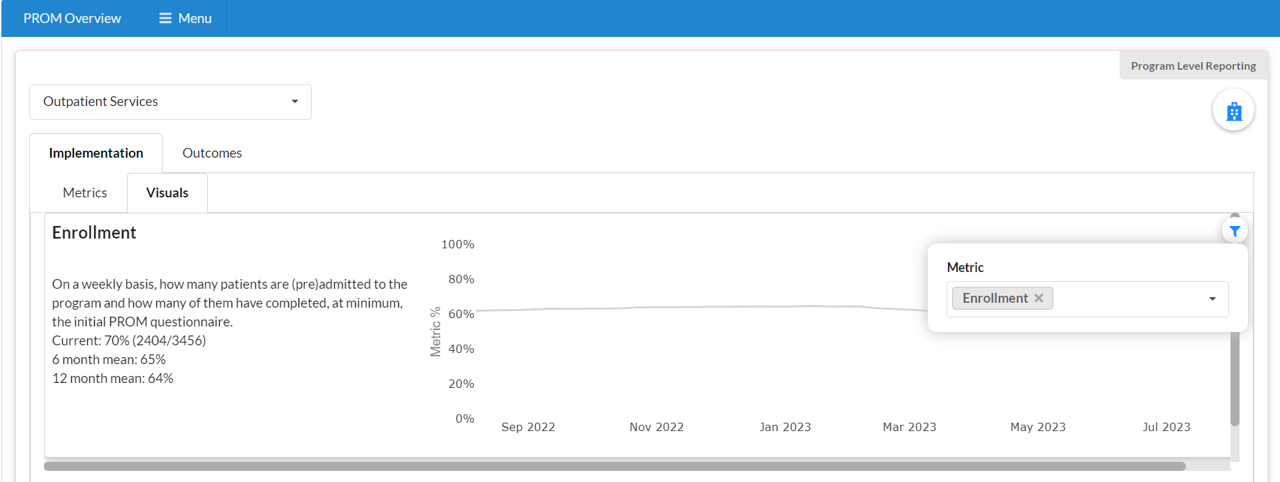
Click "View" to open a graph that documents the week-to-week fluctuations in the implementation metrics.
There is a smaller filter that appears in the graph that allows you to select additional metrics graphs to view.
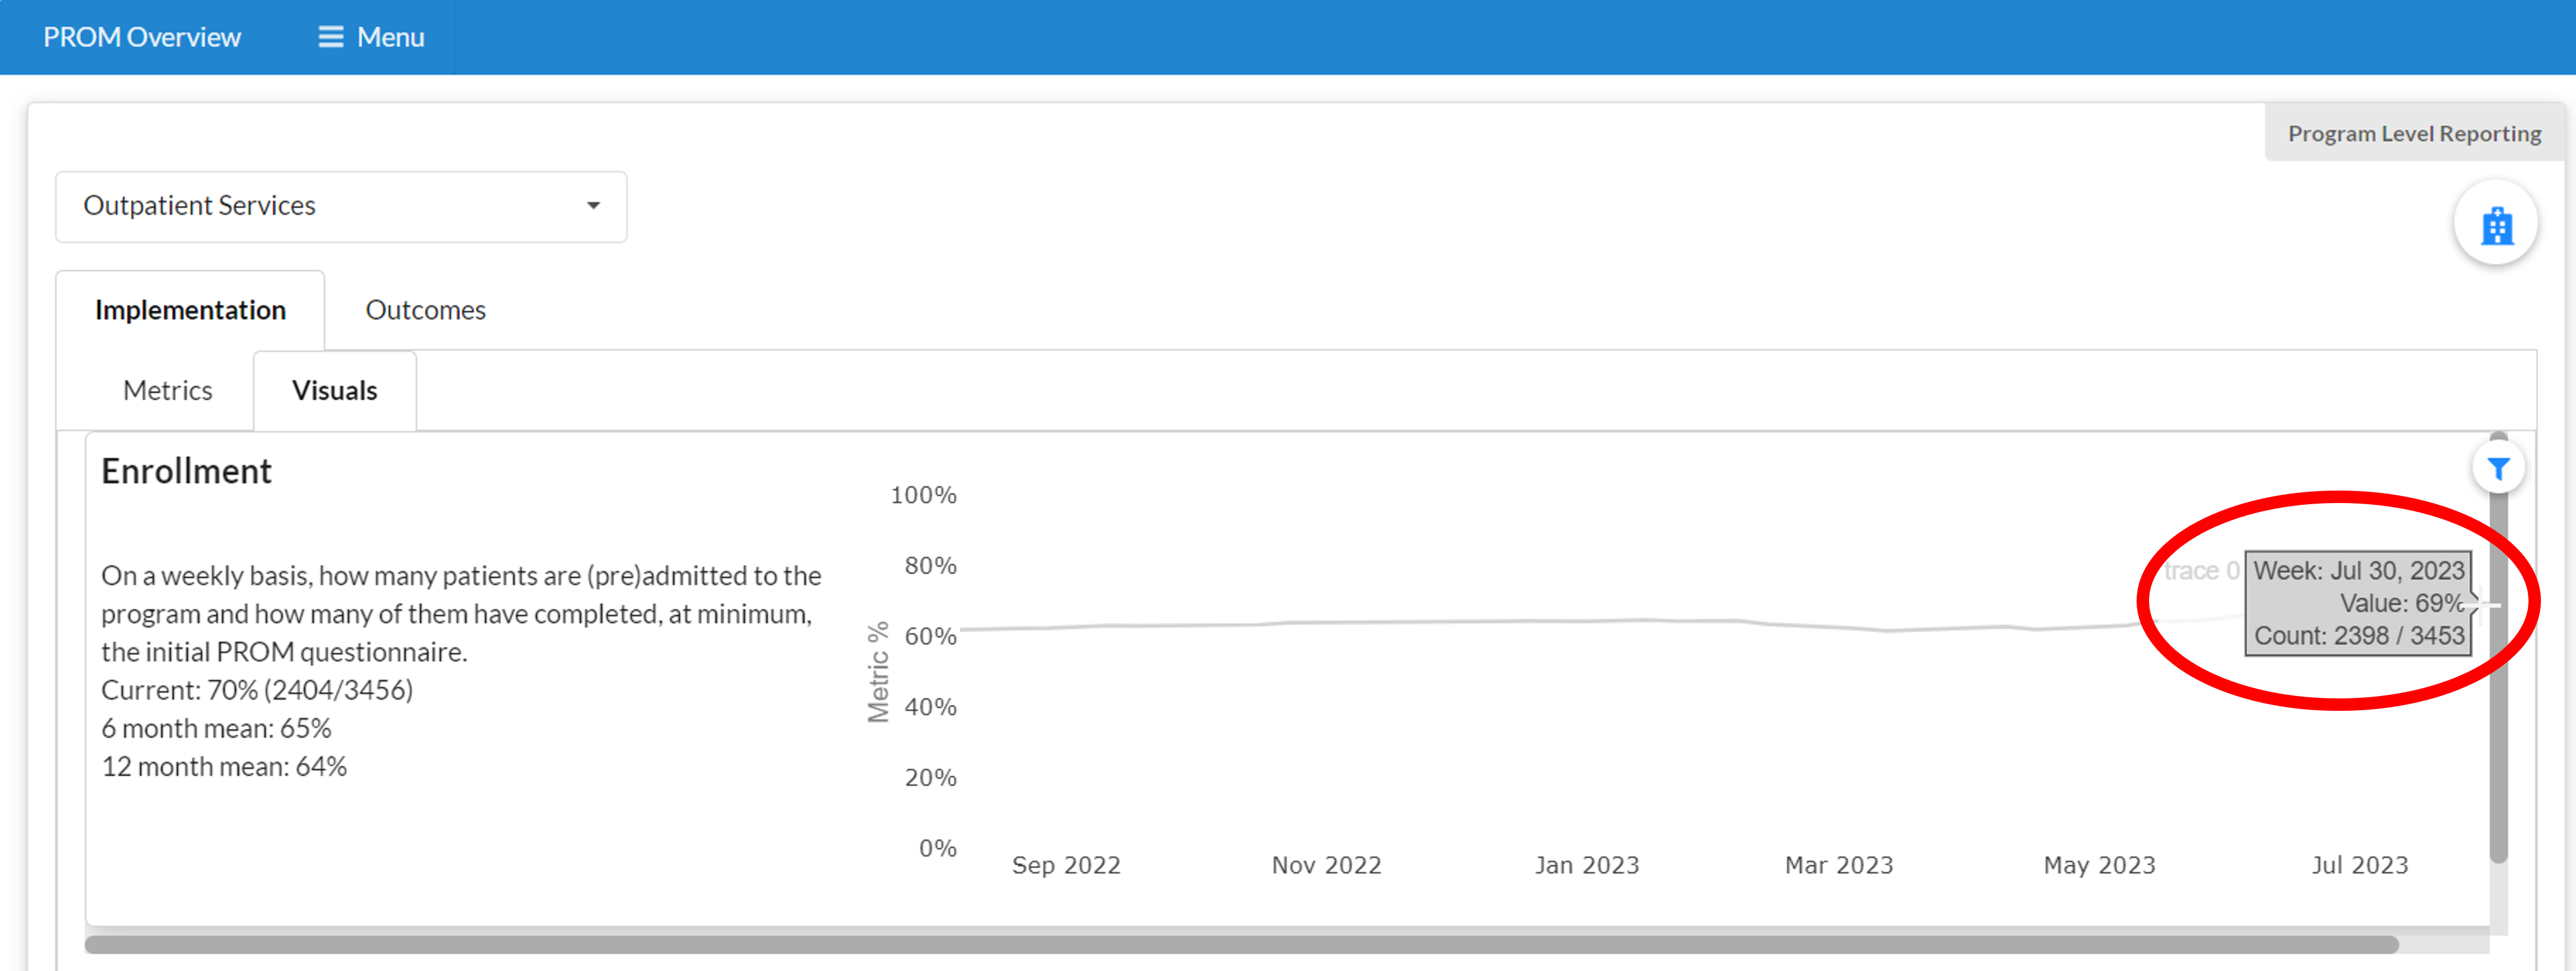
Hovering over the line with your mouse/cursor will show the date and percentage.
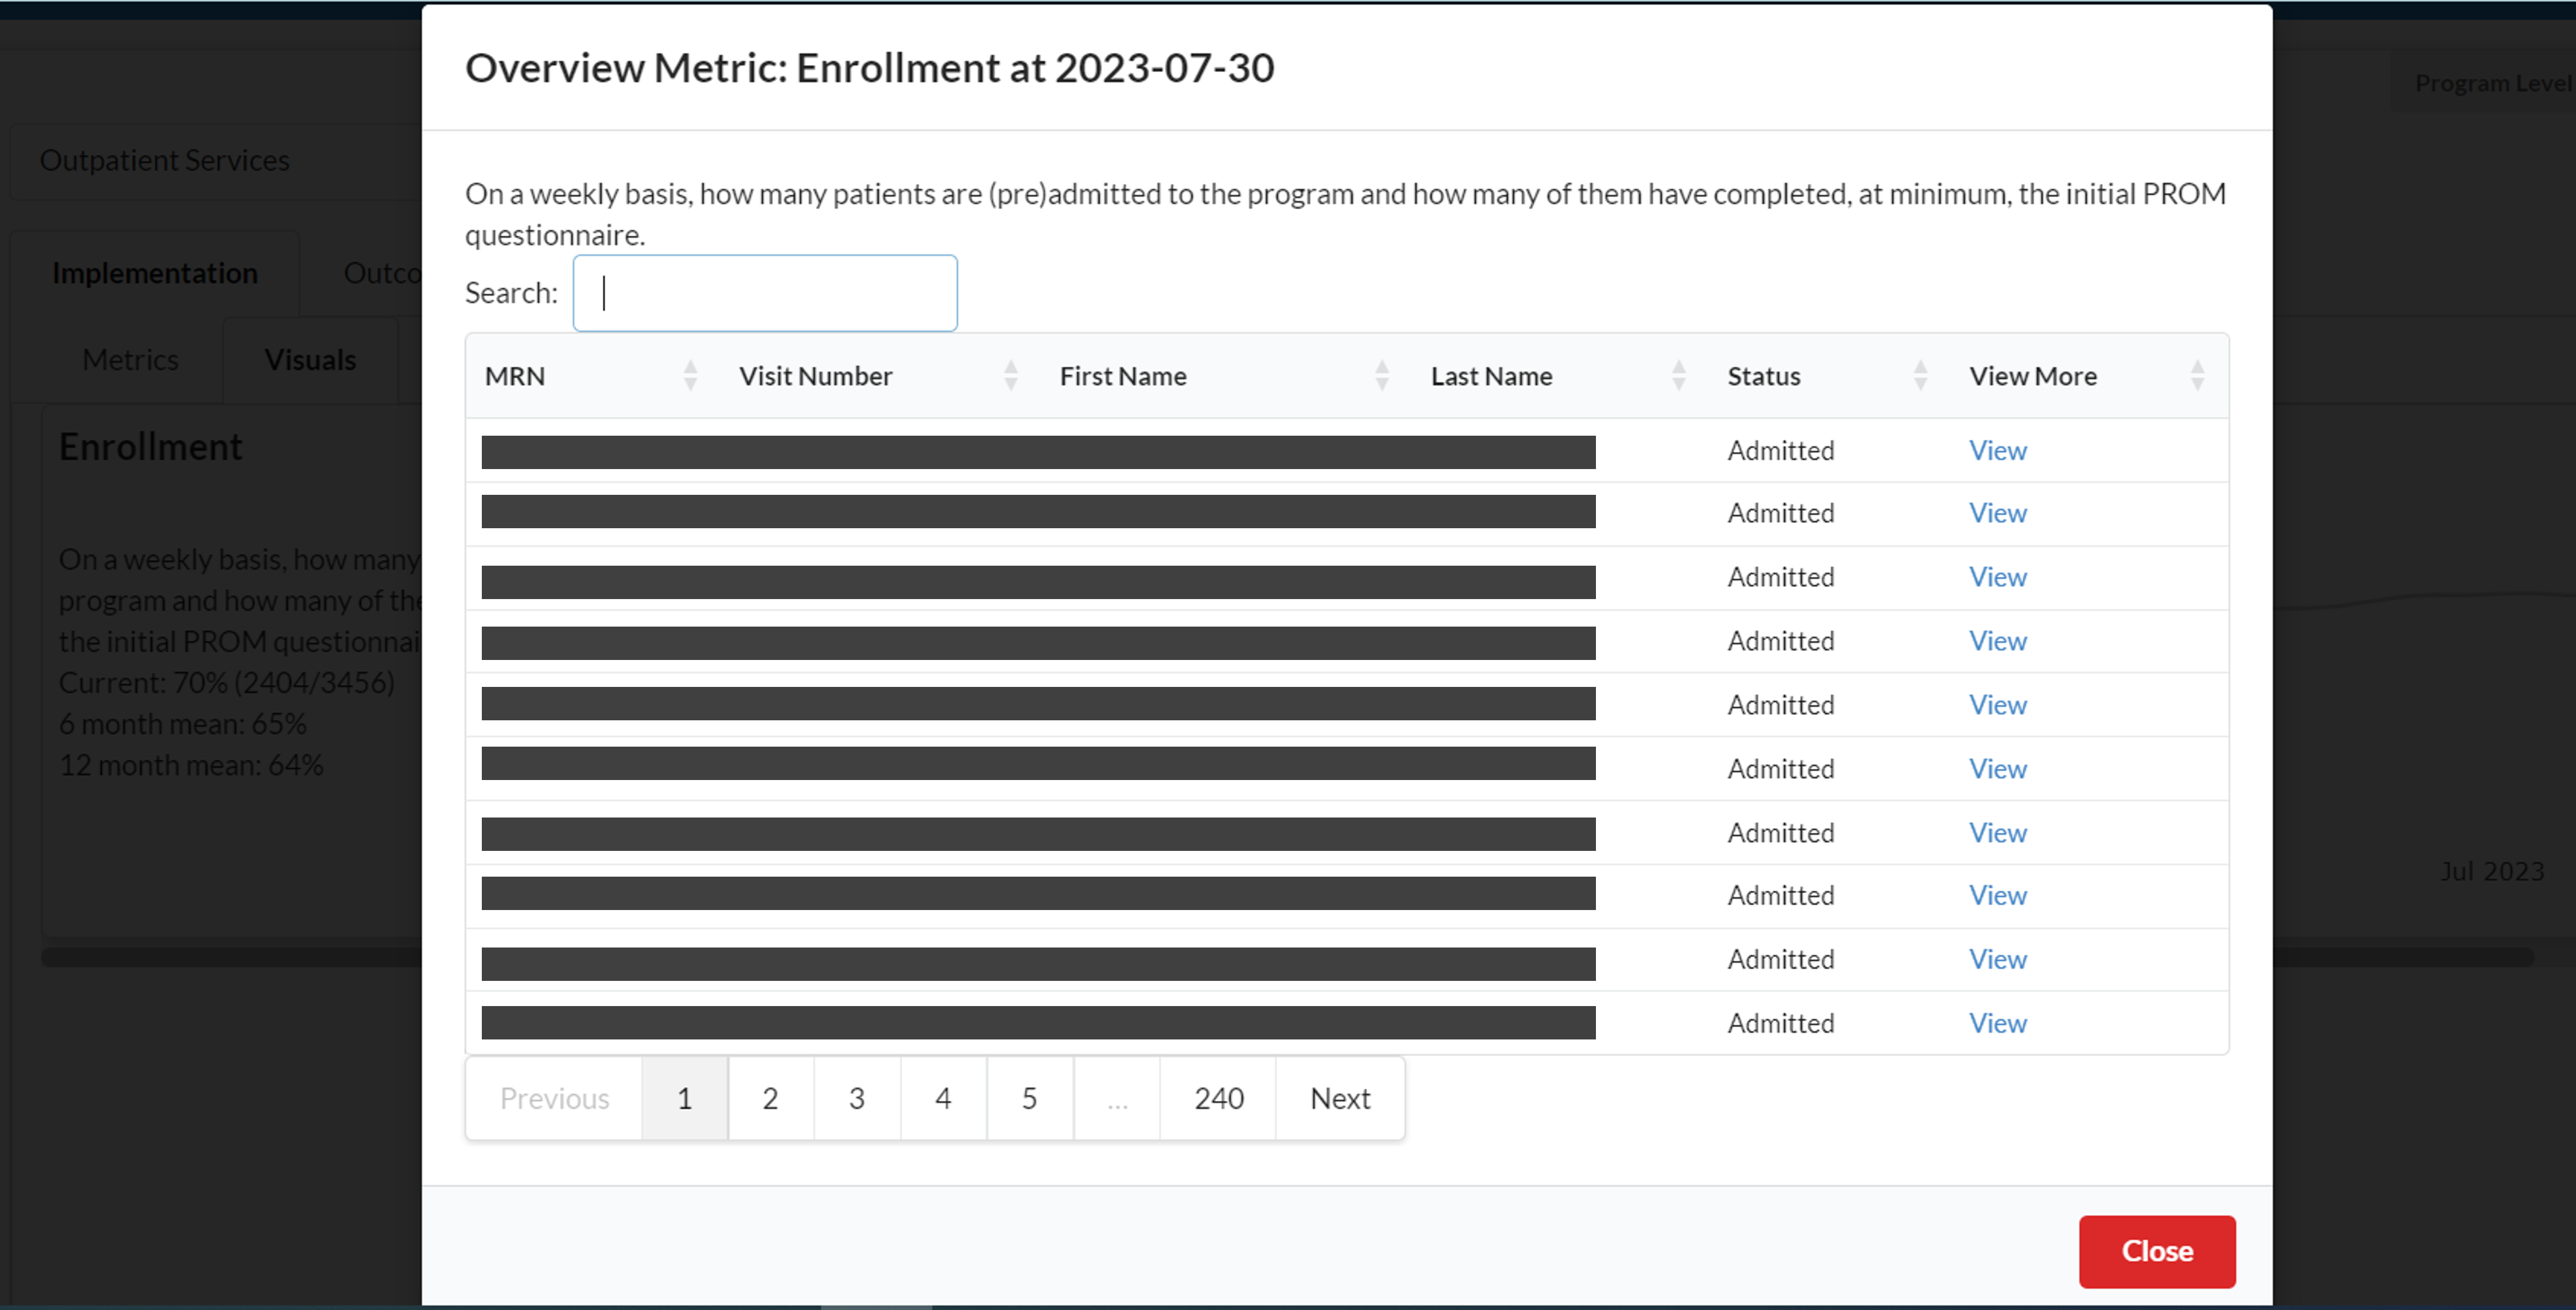
Clicking on a point on the line graph will open a table of the patients that are included in the numerator of the metric. Selecting “View” will take you to the patient’s individual patient dashboard.
Outcomes
Outcomes metrics are also visible from the PROM Overview. When opening the metrics for your program, navigate to the Outcomes tab to view the various PROMs that patients have completed. Like the implementation metrics, you can use the hospital icon to apply various filters for mnemonics, locations, and providers that are associated with the dashboard/program selected.
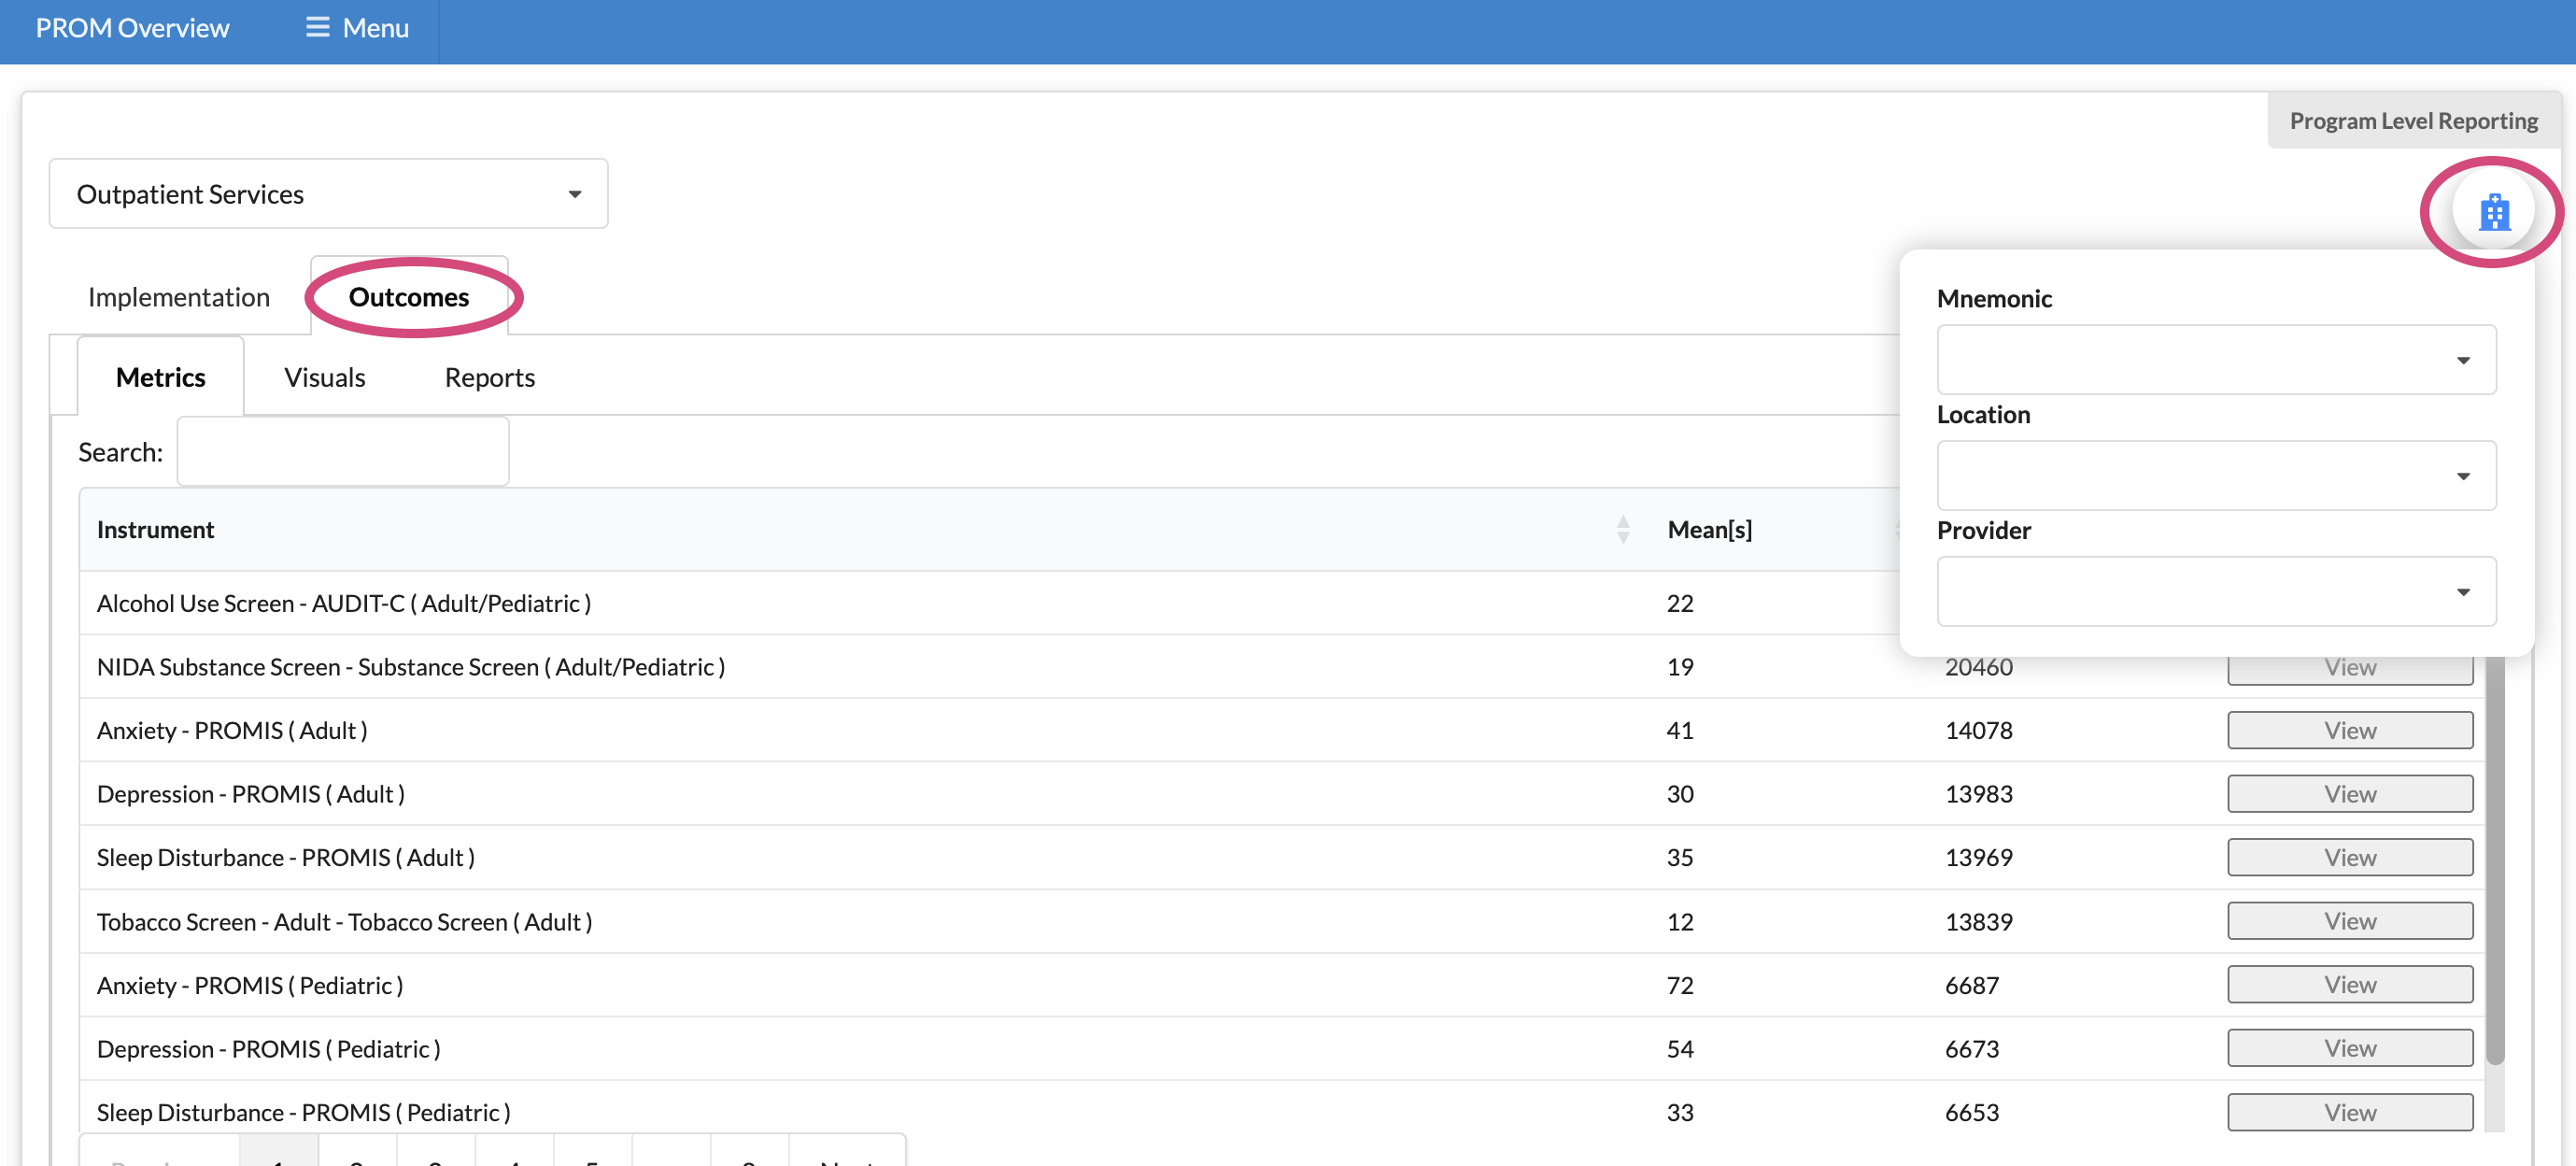
Click on "View" to open a bar graph displaying the number of patients who are improving, worsening, stable (within normal range), or unchanged (within abnormal range). The graph defaults to a month-to-month view
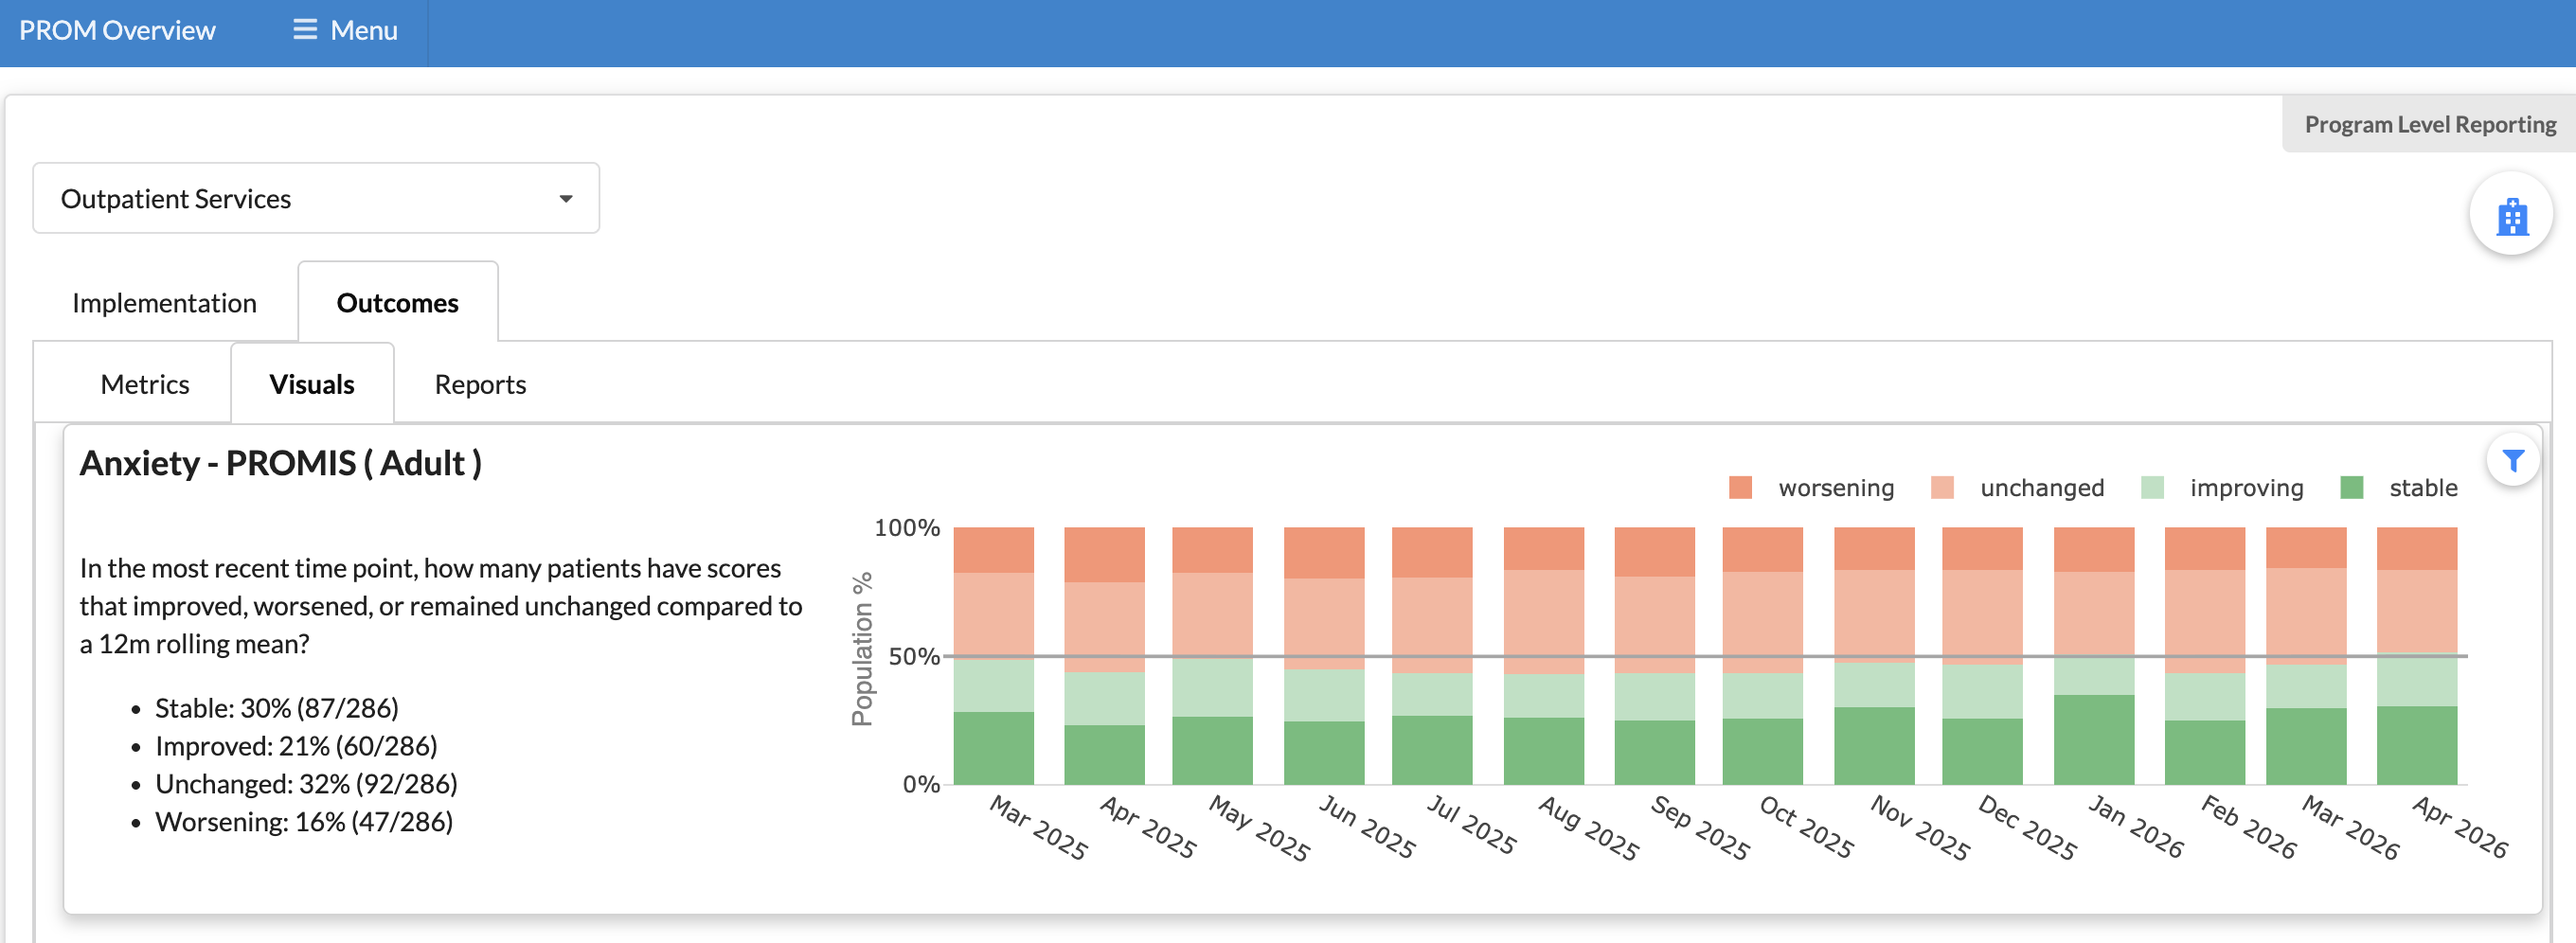
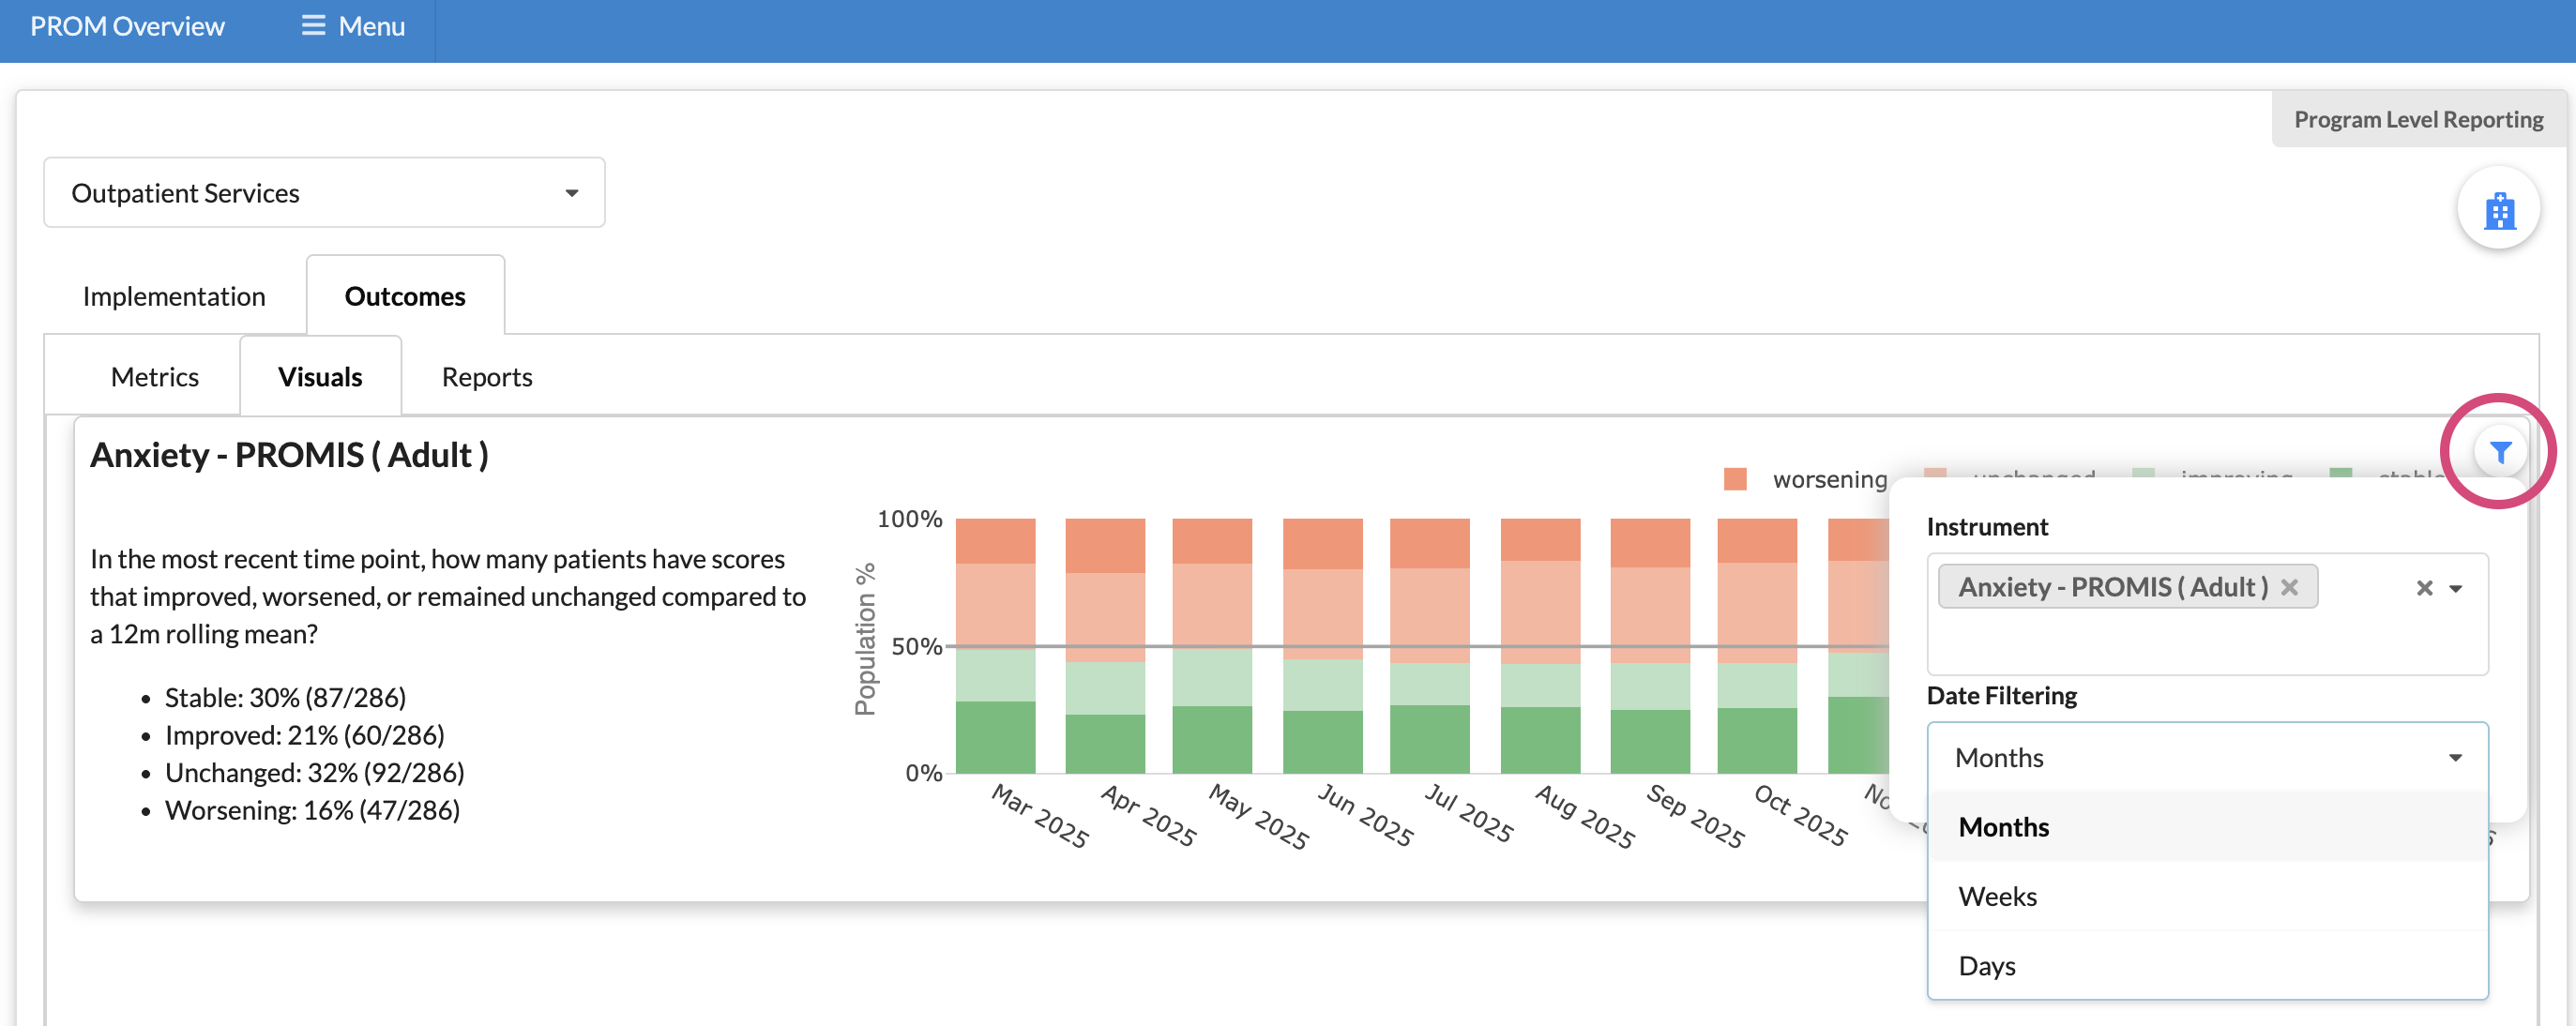
There is a smaller filter icon that appears in the graph that allows you to select additional metrics to view and allows you to change the date range filter to week-to-week (displaying up to the last 3 months) or day-to-day (displaying up to the last month)
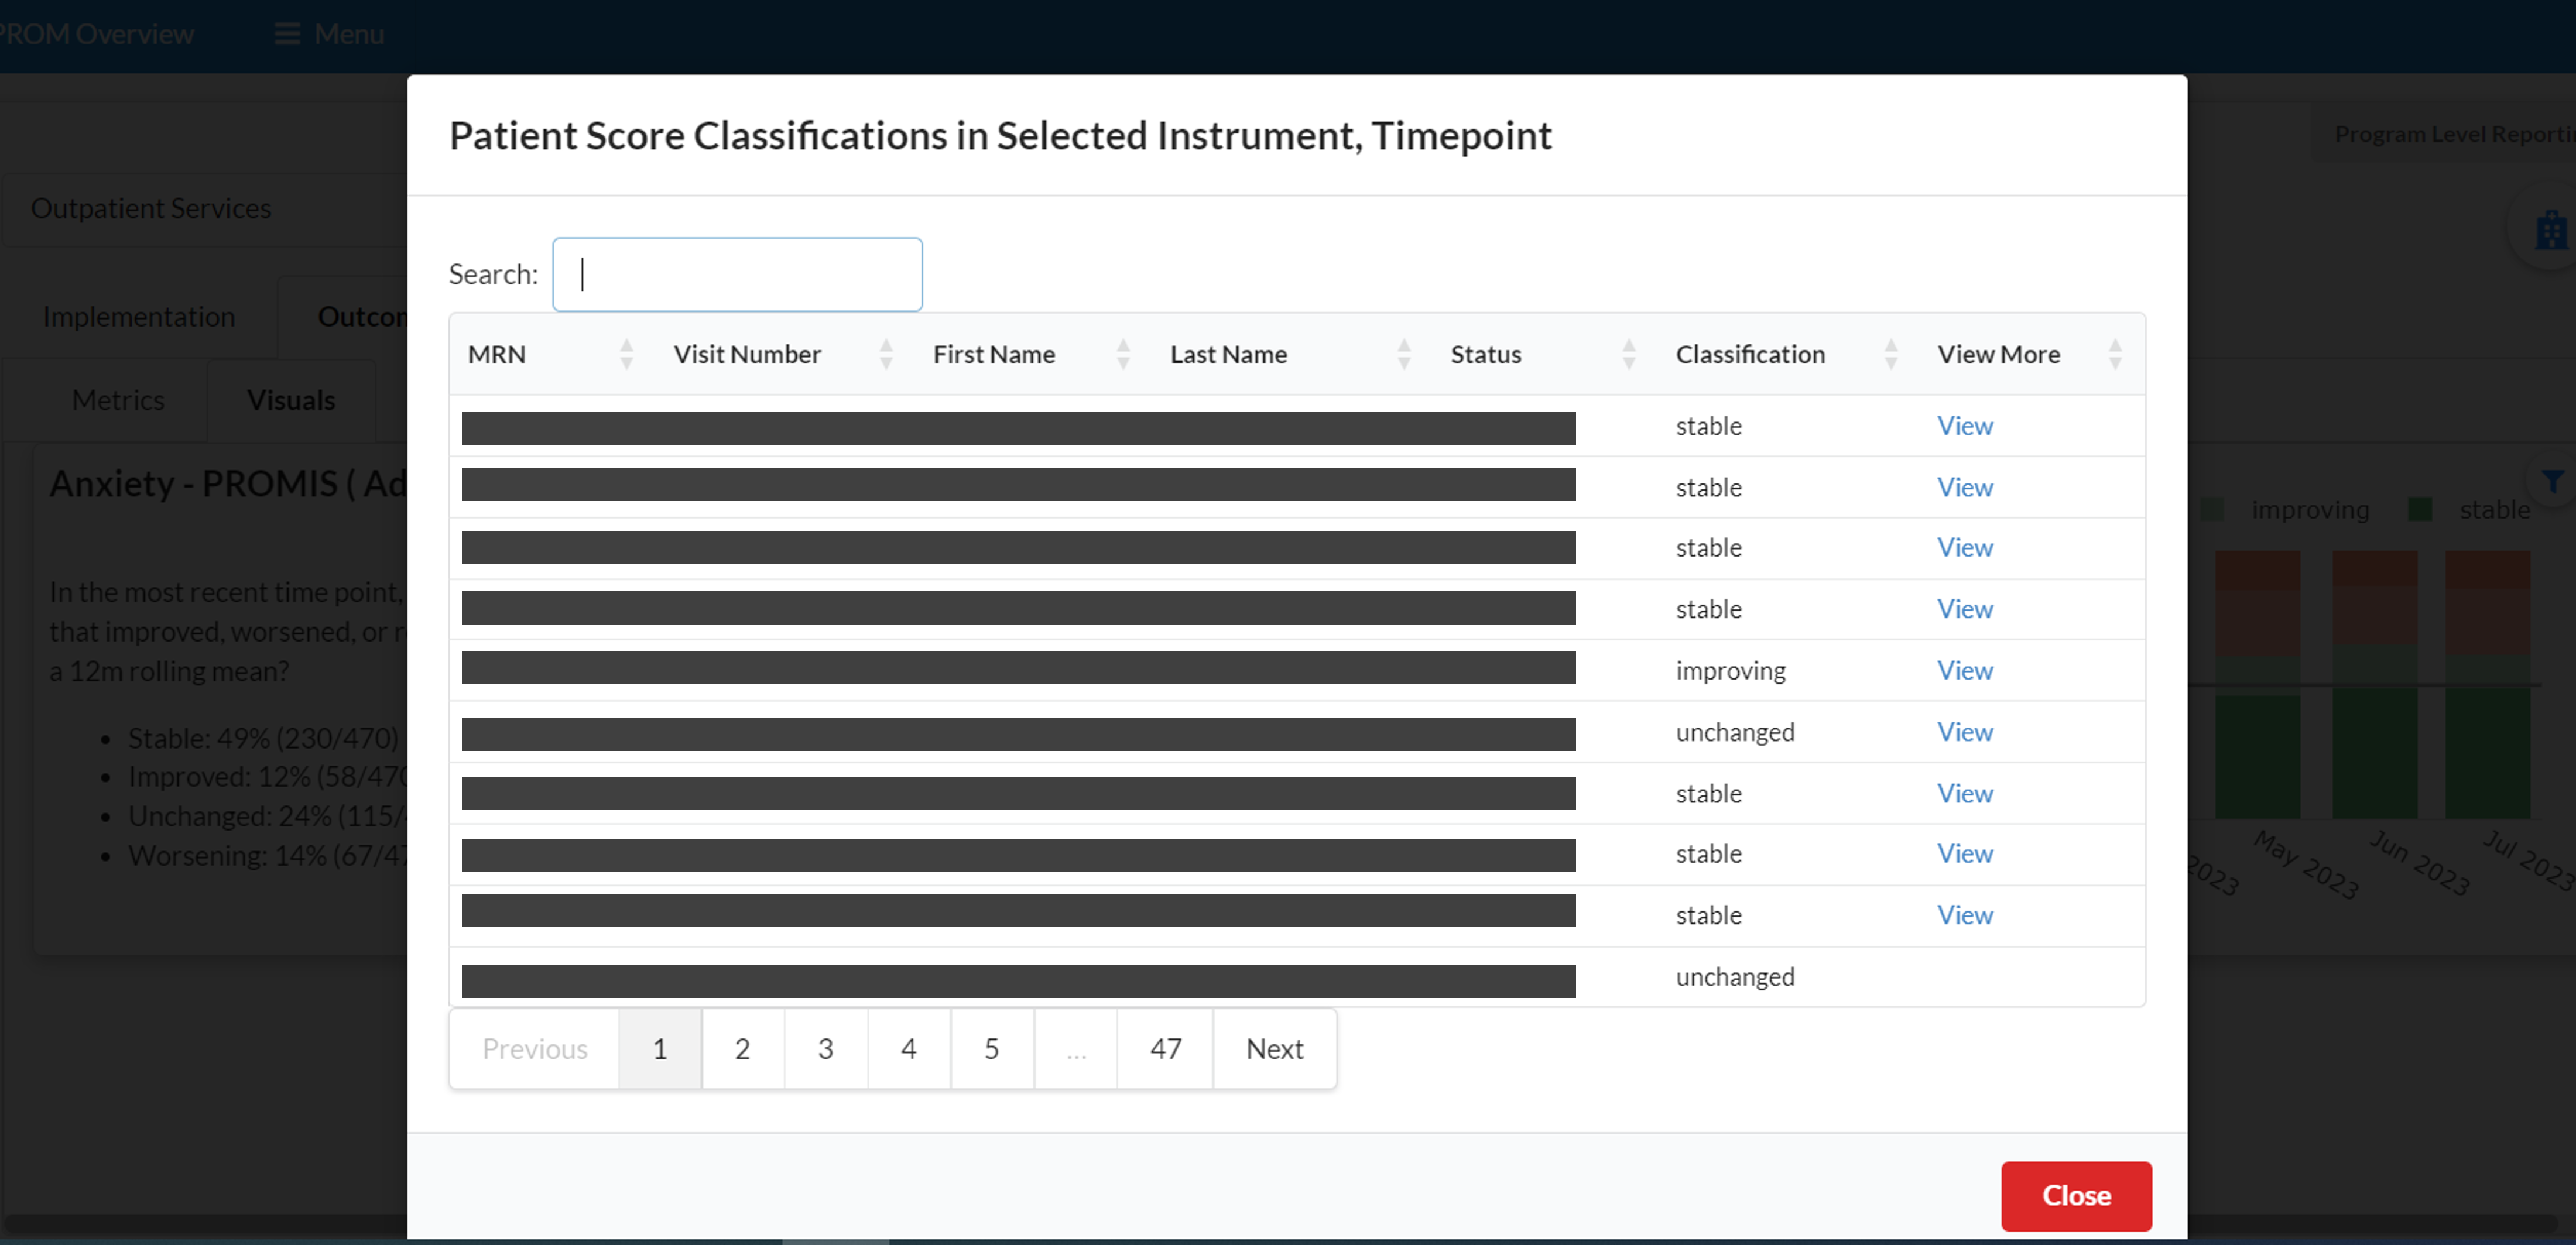
Clicking on a bar graph will open a table of the patients and their score classification for the selected date/date range. Selecting “View” will take you to the patient’s individual patient dashboard to view their scores.
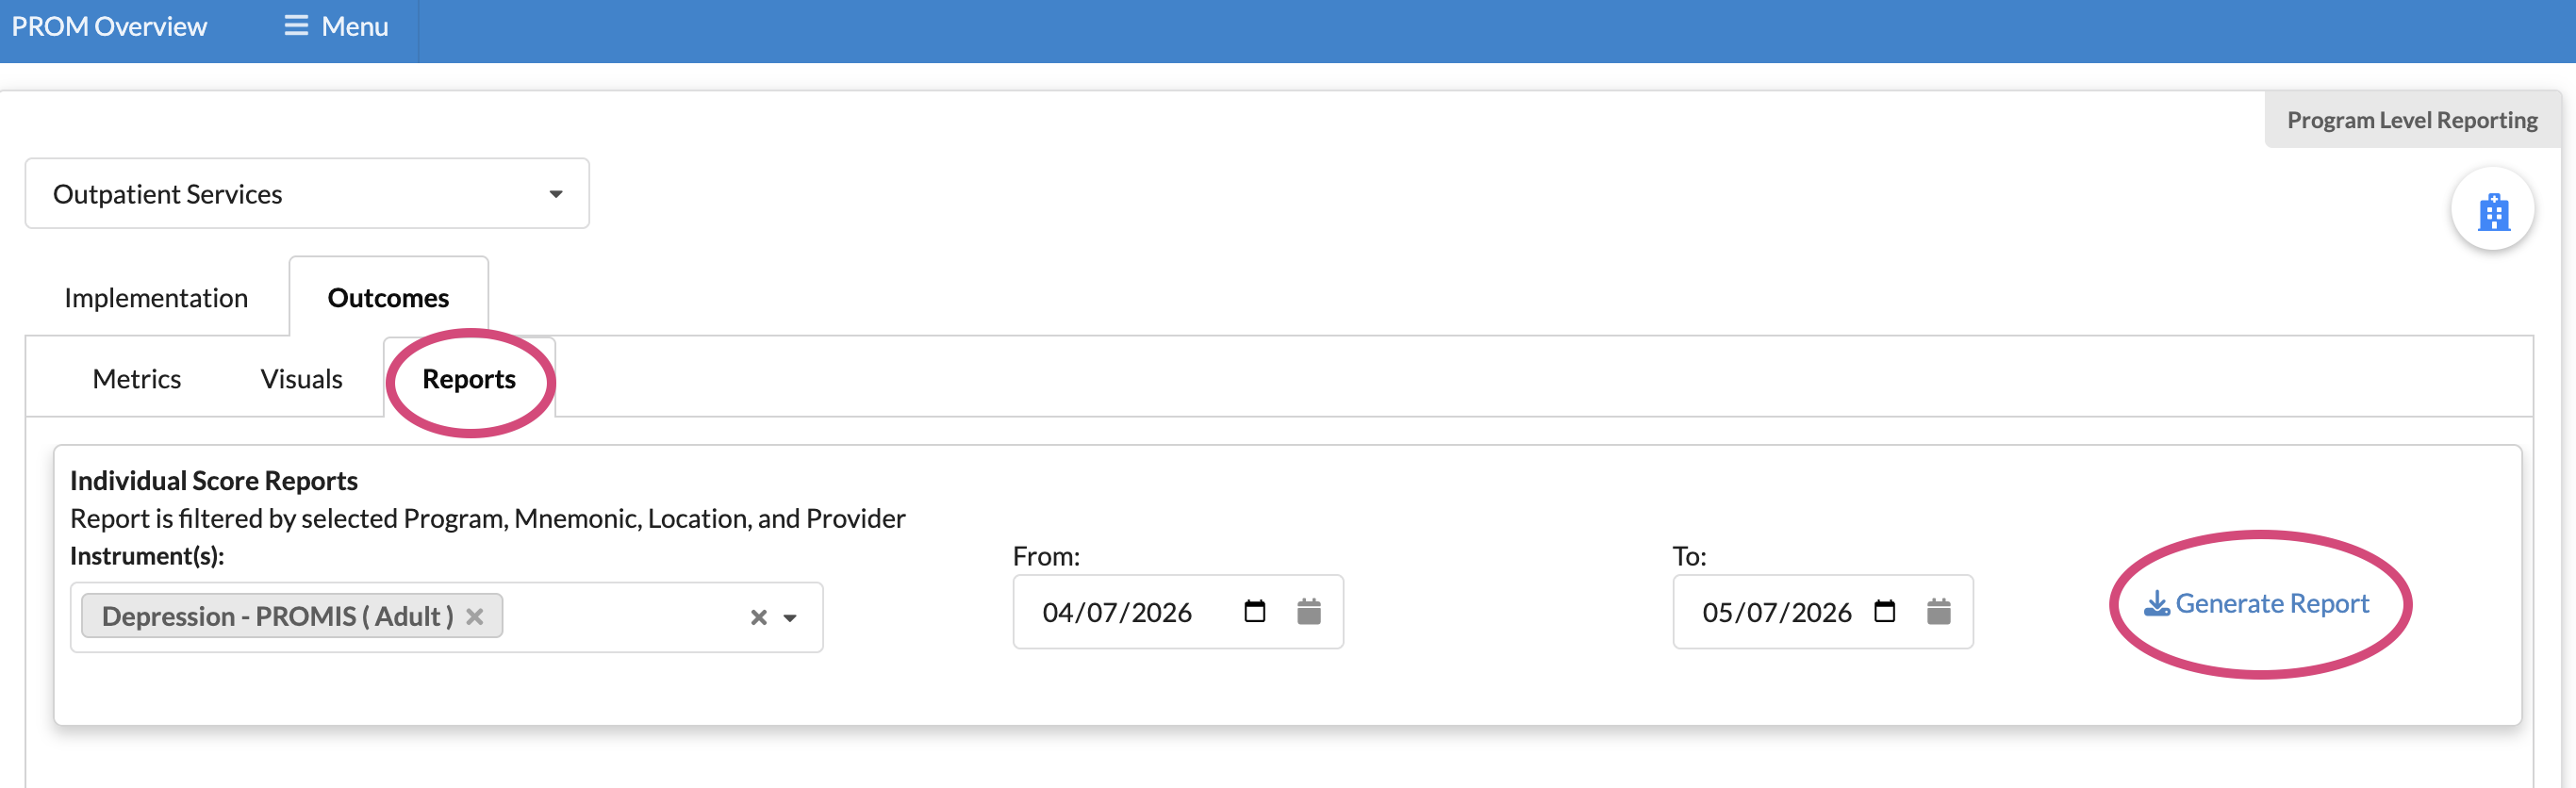
Outcomes reports
In addition to the above graphs and patient list of outcomes, you can also generate a report of PROM scores by instrument, program/location/unit, and date completed using the Reports tab.
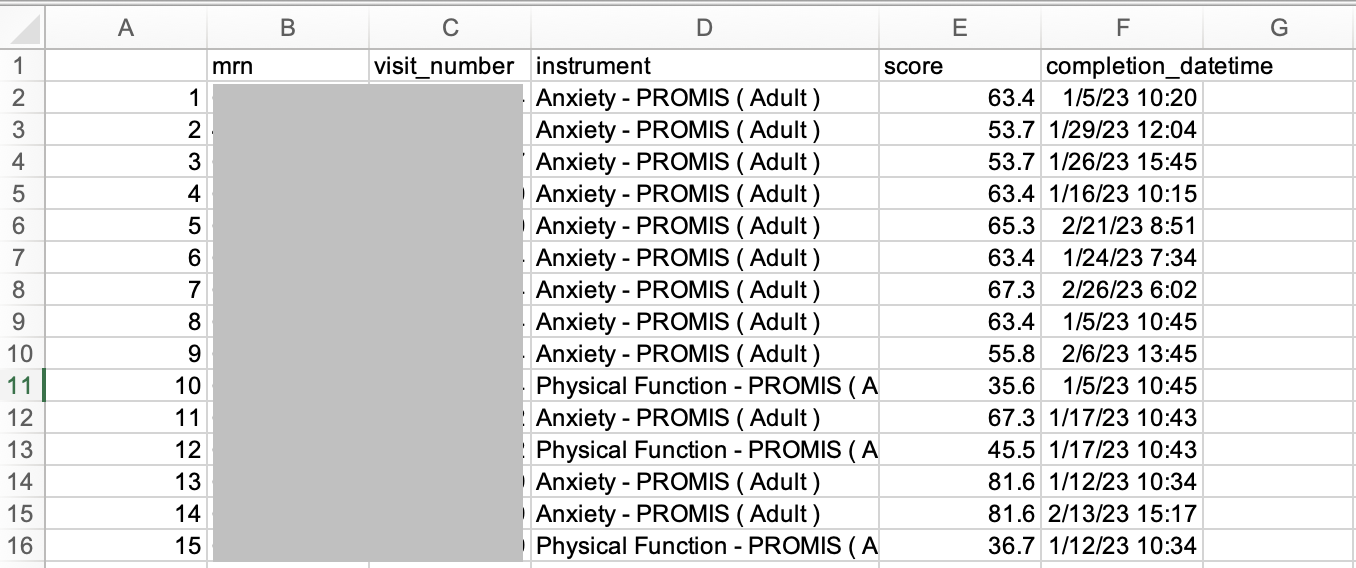
Select any combination of instruments, your preferred period in the date selector fields, and any program specific filters using the hospital icon in the upper right corner. Then select Generate Report to download the .csv file that can be opened in Excel.
Please continue reading to learn about the classifications used in the outcome metrics and individual patient dashboard.