
The source of the majority of PROMs available for you and your patients is PROMIS (Patient-Reported Outcomes Measurement Information System). PROMIS measures were developed to be universally-relevant across patient populations and use item-response theory (IRT), in which item banks are created based on pooling all known measures of the specific health-related construct. For more information: PROMIS Scoring.
What are PROMIS Scores?
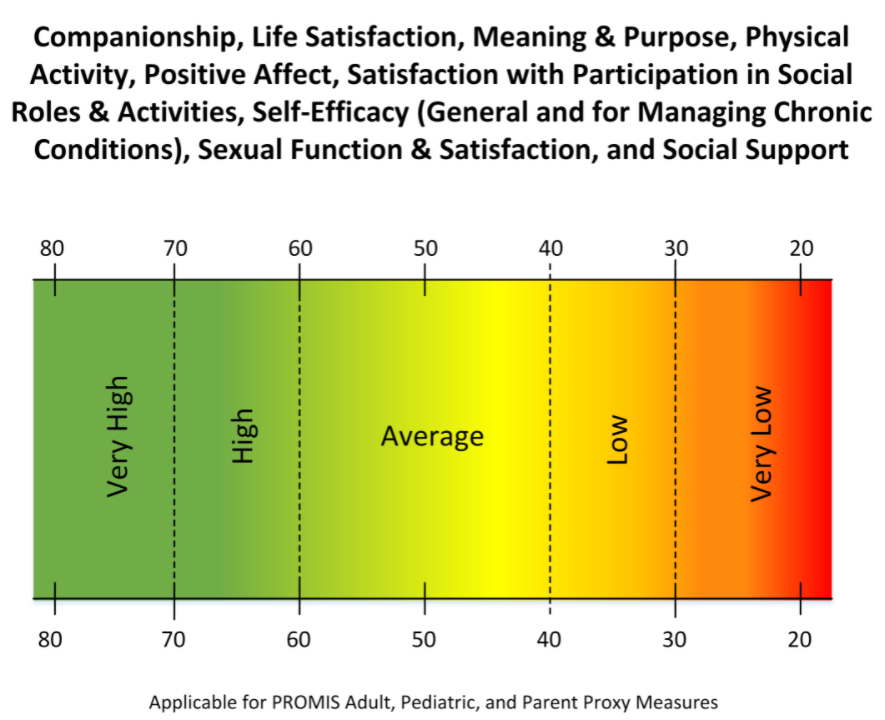
PROMIS assessments are scored on what is called a T-score metric. High scores mean more of the concept being measured. 10 points on the T-score metric is one standard deviation (SD).
PROMIS scores have a mean of 50 and standard deviation (SD) of 10 in a referent population. The referent population is usually the US General Population.
- A score of 40 is one SD lower than the mean of the reference population.
- A score of 60 is one SD higher than the mean of the reference population.
Interpretation
- Scores 0.5 – 1.0 SD worse than the mean = mild symptoms/impairment
- Scores 1.0 – 2.0 SD worse than the mean = moderate symptoms/impairment
- Scores 2.0 SD or more worse than the mean = severe symptoms/impairment
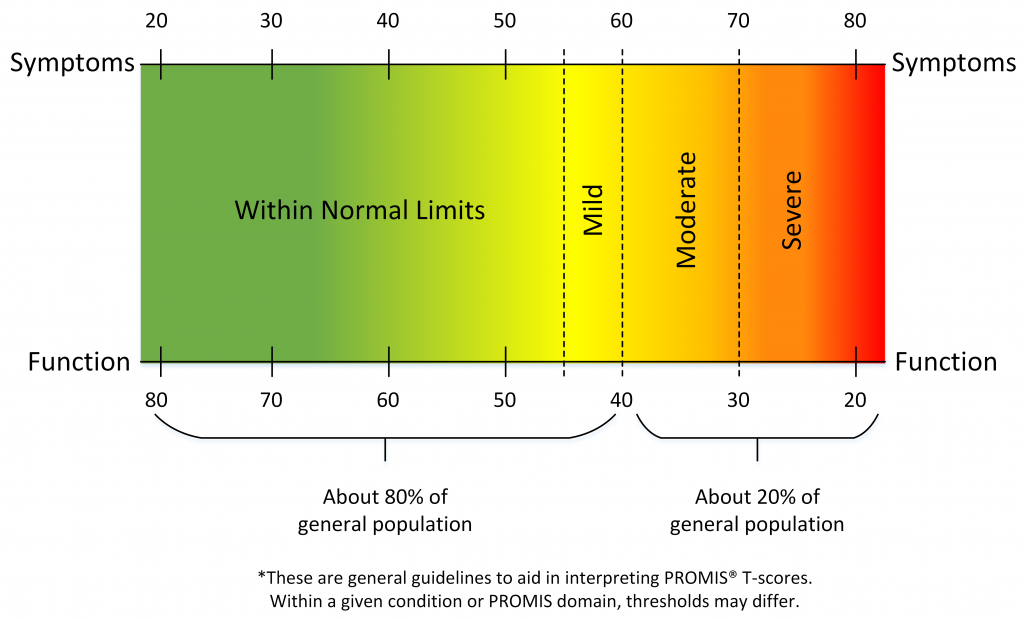
Some PROMIS assessments have slightly different score cut points and severity ranges.


Please continue reading to learn how to customize PROMs for your patient.
For program/site managers, please continue reading to learn how to customize PROMs for all patients in your program.
Please continue reading to learn how to send an ad-hoc or one-time PROM to your patient.